Monitoring metrics with Zabbix
Whilst exploring UTM for running virtual machines on Mac, I came across an all-in-one observability solution called Zabbix. Zabbix is used for operations and security teams to monitor all kinds of activity running on VMs, Networks, Operating Systems, Log files and much, much more. Additional features include audit trails, RBAC, event logs, triggers, alarms and dashboards.
After installing and booting various VMs, I figured now was the perfect time to setup Zabbix and test its features.
Installing Zabbix
I installed all Zabbix components on a single host machine, in this case an Ubuntu VM. All the steps can be found here. Simply select your OS configurations and the install steps will match the necessary requirements. My install configuration was composed of:
- Zabbix 6.4
- Ubuntu 24.04 Arm64
- PostgreSQL
- Apache server
I did have a minor hiccup during these steps, mainly due to the postgresql install. I had 2 postgresql installs, one in ../../usr/lib/ and another in ../../snap/bin/. This lead the initial postgresql commands to fail due to a mismatch in a linked dependency. To resolve, I removed the snap postgresql, manually added the ../../usr/lib path to .bashrc, restarted the terminal and away I went.
Shortly after, I had Zabbix up & running, ready to monitor, analyze and report on all kinds of information in the Ubuntu VM.
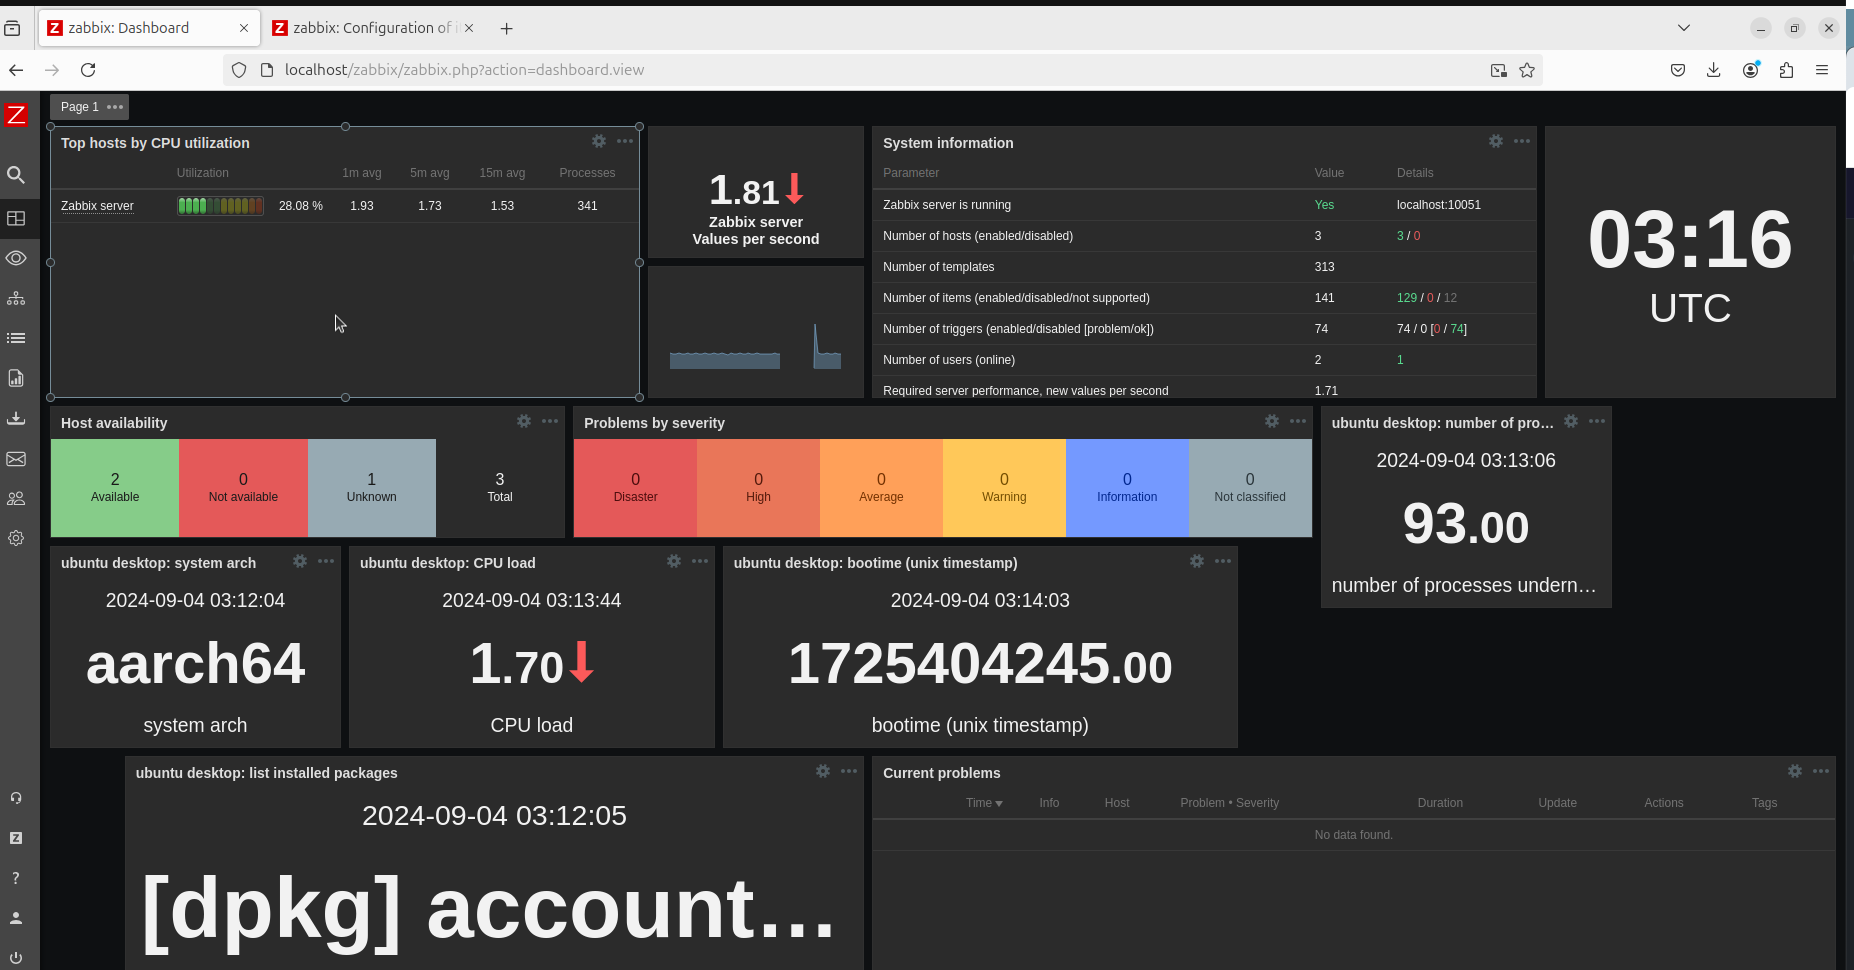
Monitoring items
Items are used to read, collect and track specific metrics. These Items belong to Groups and encompass areas such as:
- Kernel
- Network
- Web
- System
- Processes
Item 'agents' are used to configure which metrics are collected and how those actions are performed. I'll start with the Zabbix agent to collect system & process metrics. More Item types can be found here.
Before getting started, I needed to create a Host, which is essentially a device, application or service. To keep it simple, I used the Ubuntu VM as my selected Host. From here, I can begin add Items to my Host.
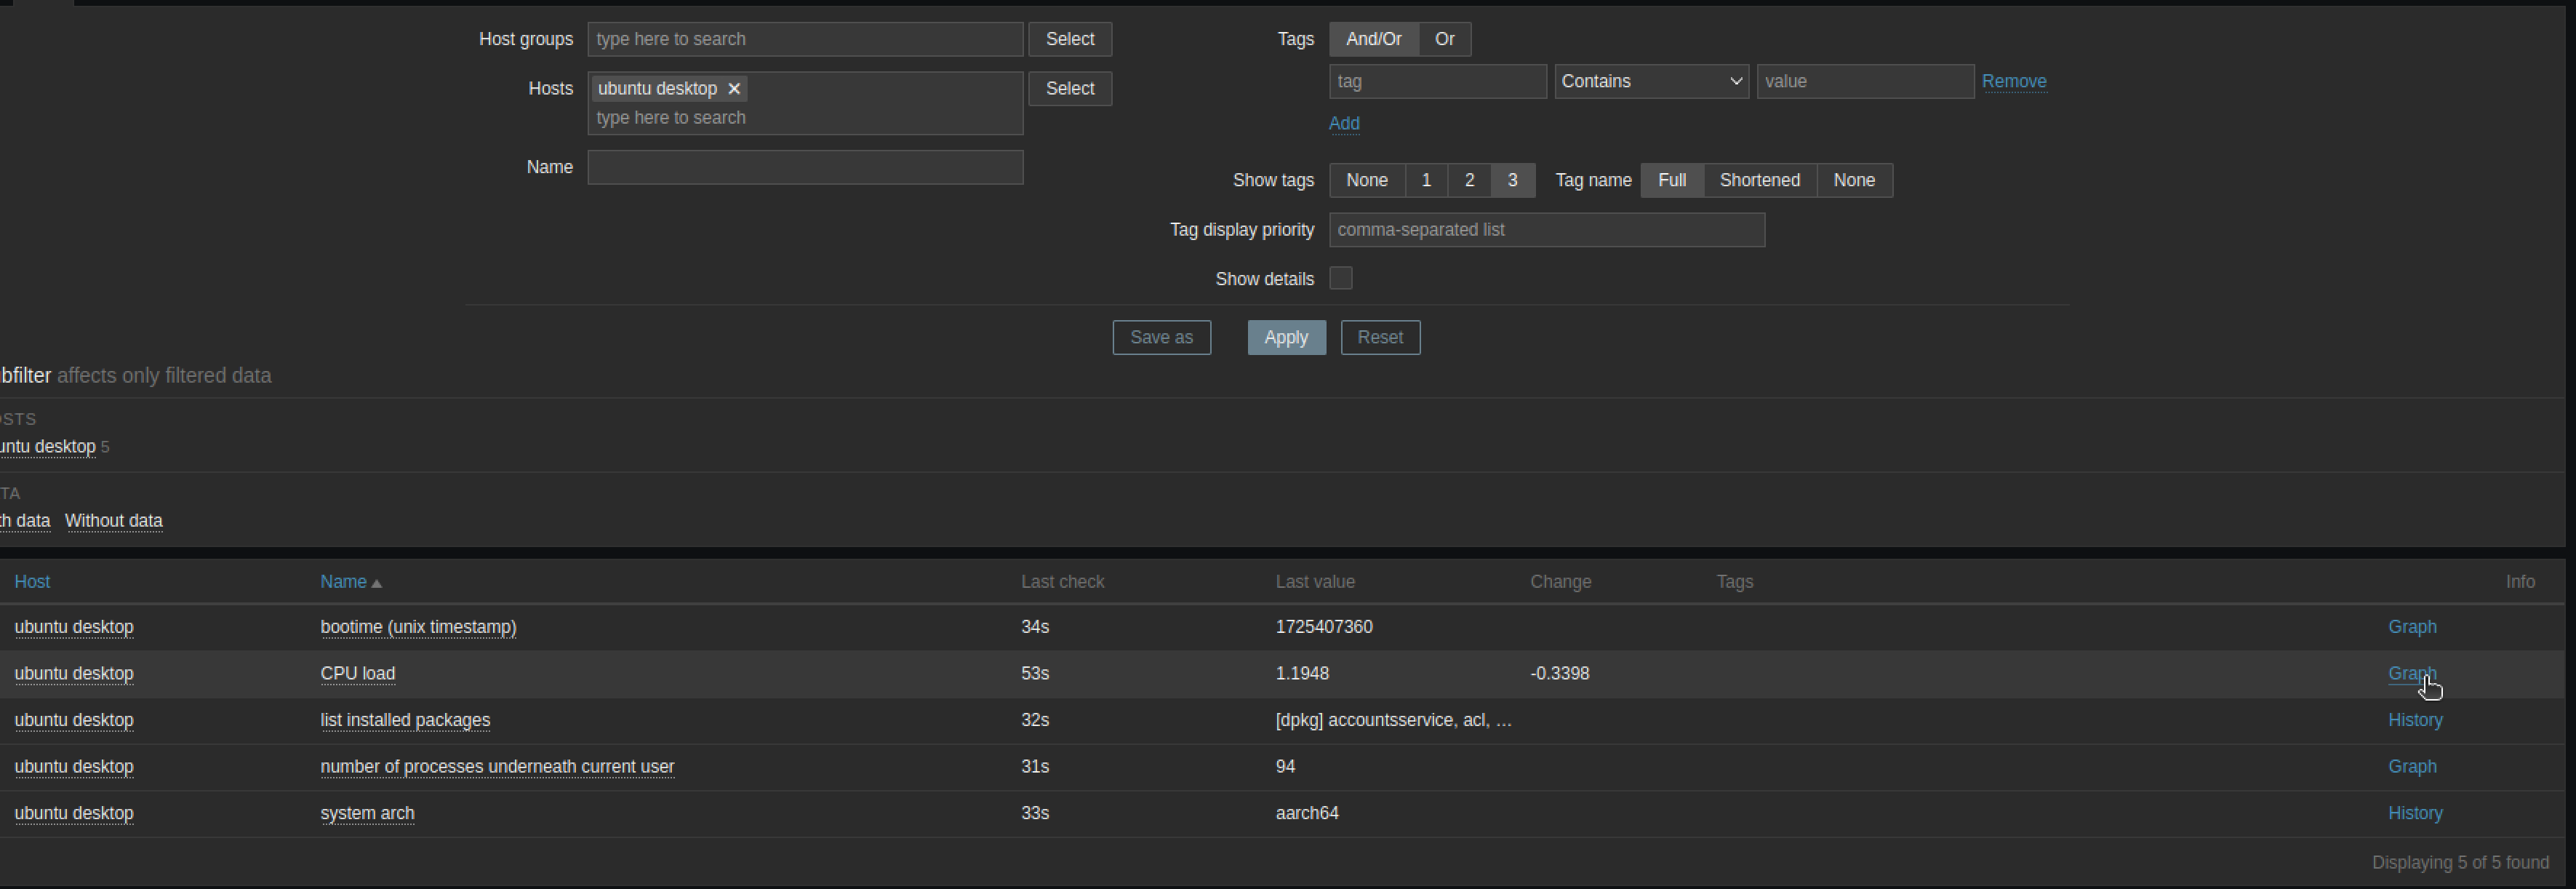
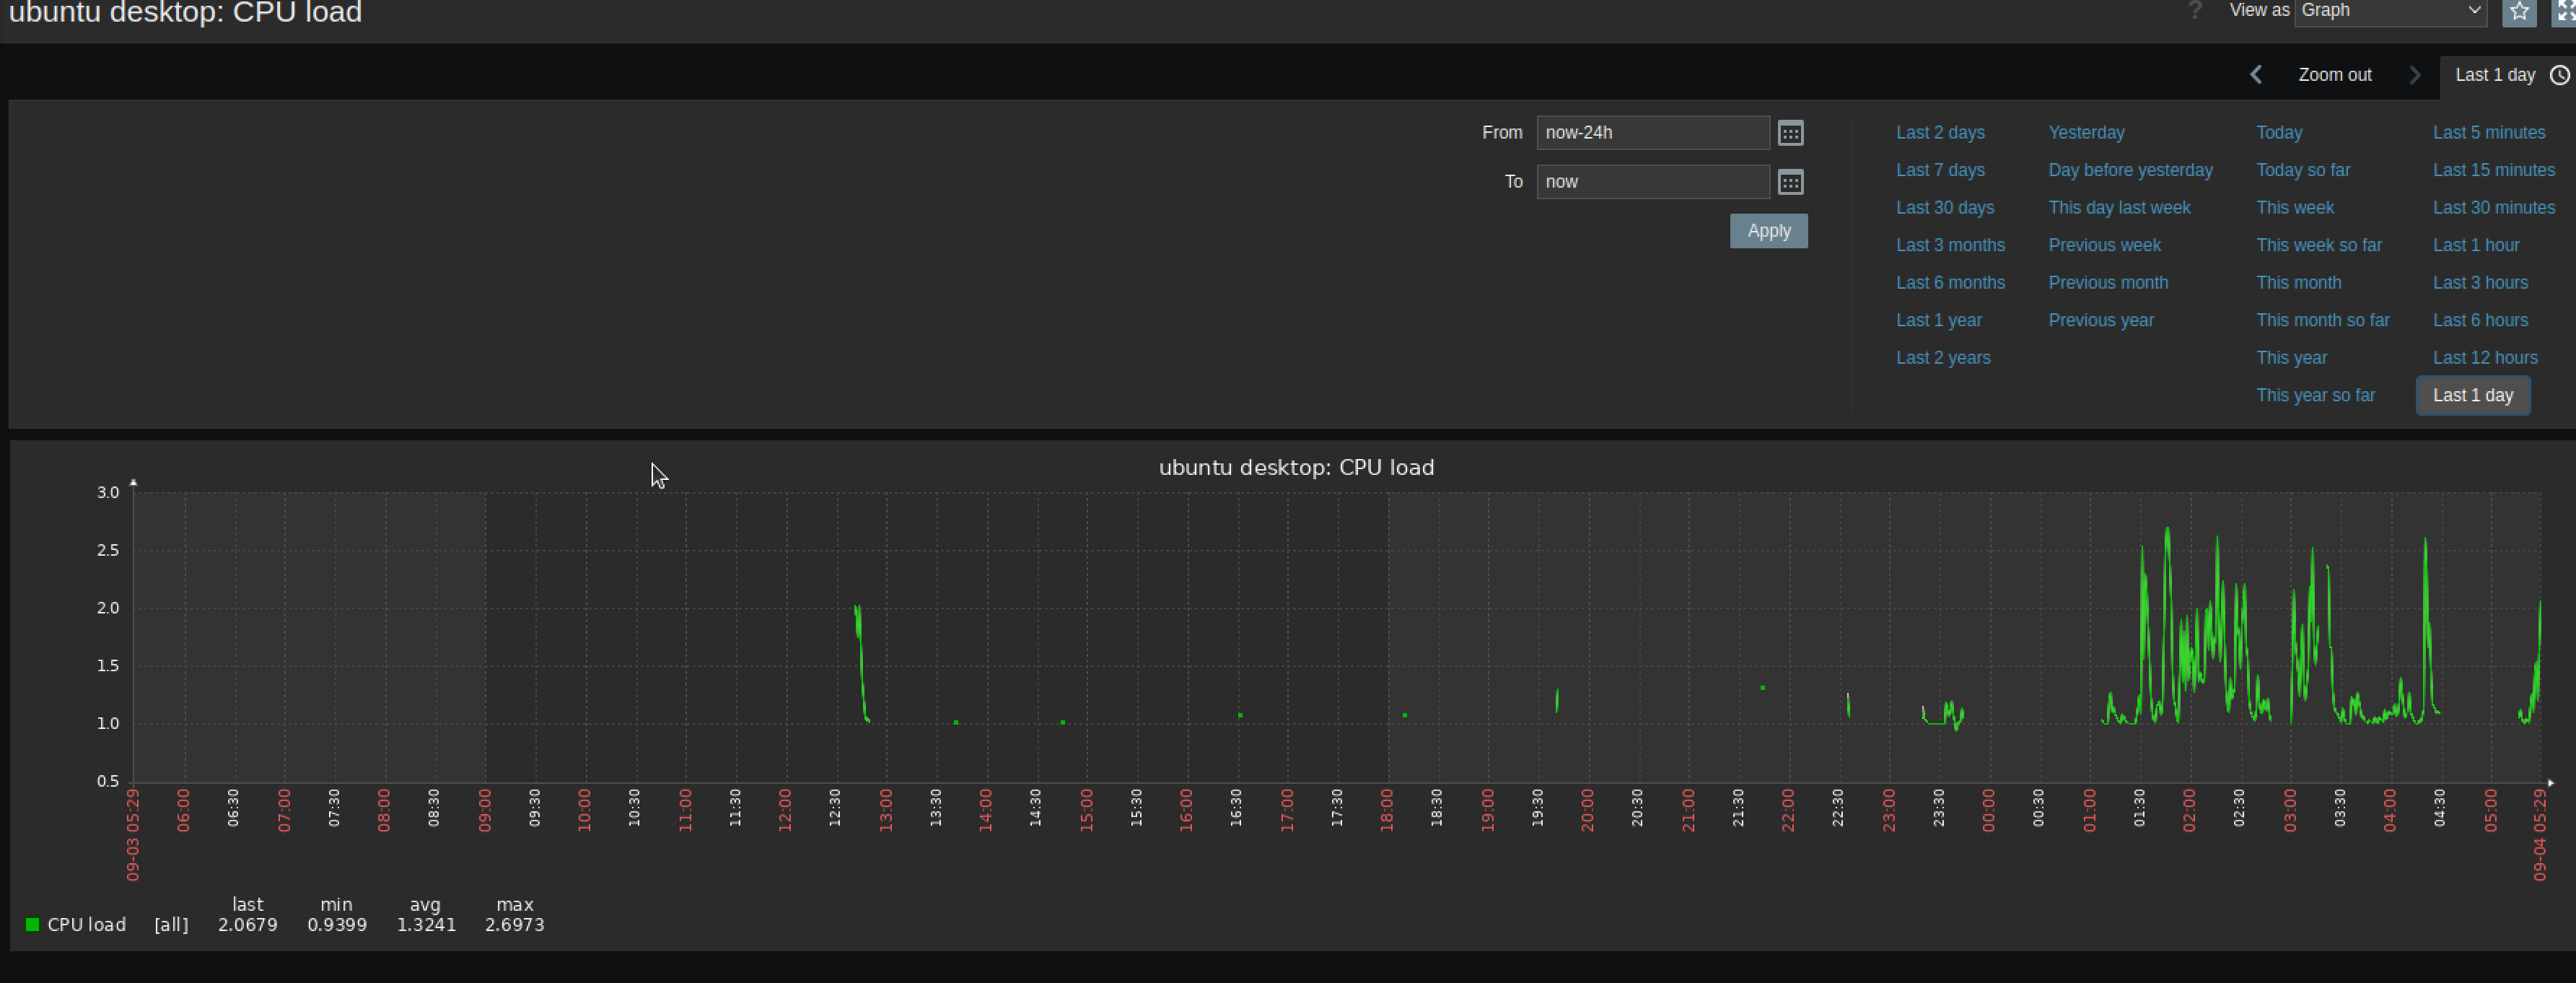
For fluctuating metrics (such as CPU load, respone times), I can view the metrics over a time period as a graph. Here I've chosen to select CPU load in the Graph view:
Triggers
Now that Items are collecting metrics, Zabbix can create Triggers to highlight problems in servers or applications. Think of these as 'alerts'. These Trigger outputs can be displayed as widgets on the dashboard.
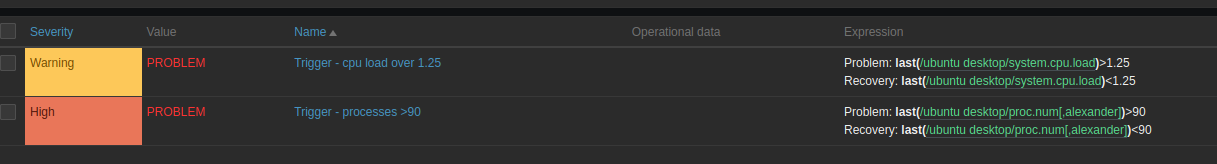
Triggers can driven by values collected from Items, and conditional expressions are used to provide a threshold or value to act as a trigger. The expressions allow a problem & recovery condition to be met.
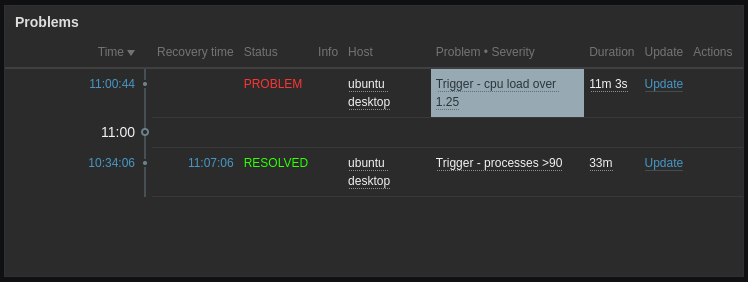
Once Triggers are created, with an severity priority level, they can be added & presented on the dashboard. The widgets each update using customised intervals, allowing a live representation of each Item's value. Below are 2 triggers in 2 different states. Here can force refresh their status or wait till the next interval for the Trigger's expression to re-evaluate.
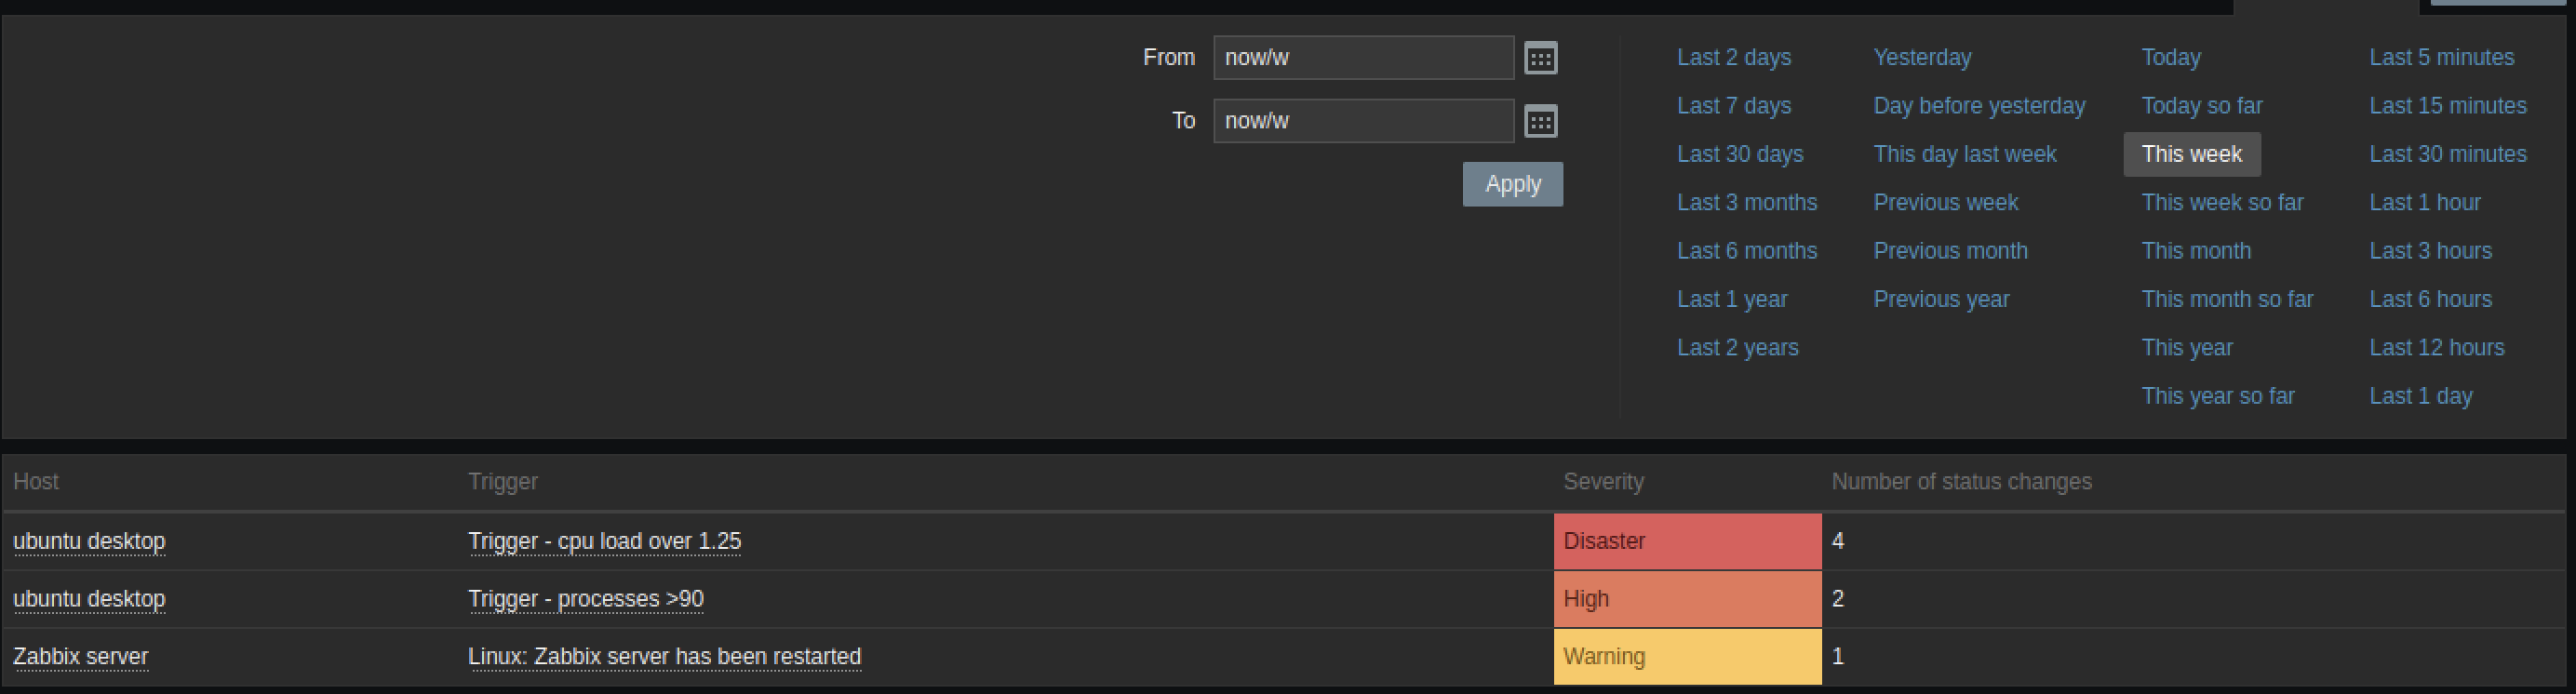
Going deeper in Zabbix, you can also view Trigger execution over a time range. Useful when wanting to review the most frequent triggers and troubleshoot problematic causes.
Audit logs
One final area which intrigued was auditing, and how an Admin team could retrieve an log of all Zabbix actions should it be required. Perhaps in the case of a mis-configuration of a Trigger, or on the more concerning scenario, a rogue user removing a server's IP from tracking.
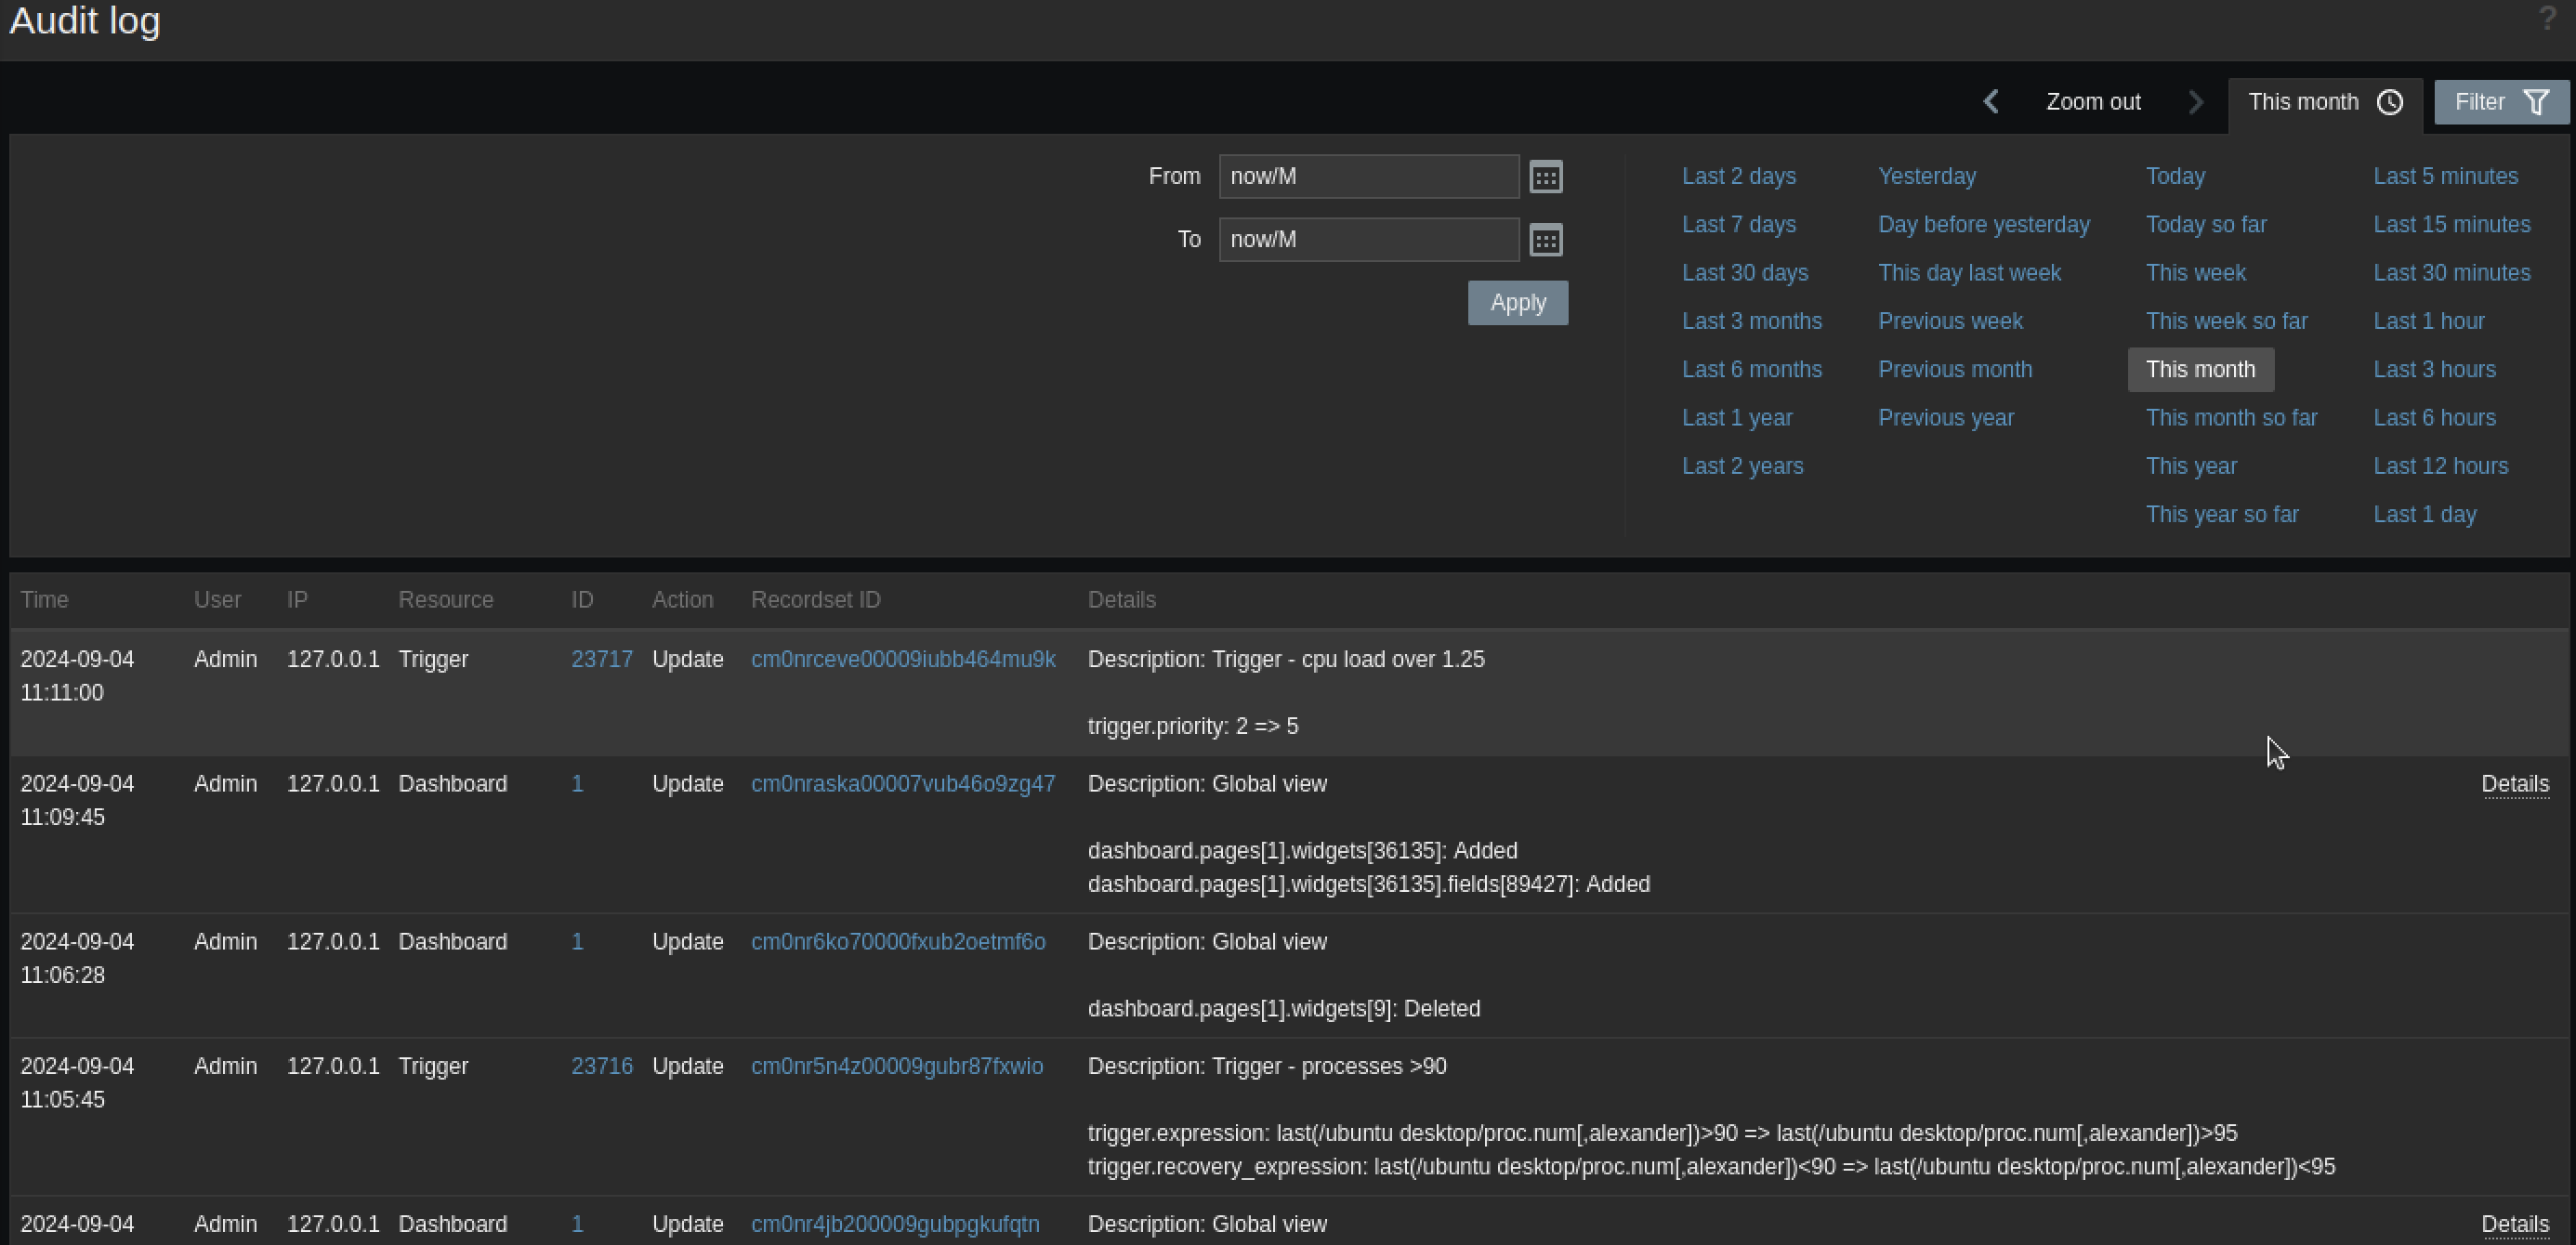
The actions I have performed so far are Add and Update. Presumably there would a be Delete also. Lastly, the time to store audit logs is set to 365d by default. Definitely don't want that the changing to 1d by mistake!
I've explored some typical features so far today and lightly touched a few other such as Alerts, Integrations and User mgmt. With that, I'm happy to call it a day.
I'm faily happy with how Zabbix performed, with configurations for Items & Triggers being self-driven and quick to create. The e2e process of producing a metric->trigger->alert flow is key for Ops teams and Zabbix delivers on this front. Its depth in detail and ability to extract a range of low level system metrics are key features.
Be it asset management, server monitoring & alert or infra security, Zabbix is a great candidate for an all-in-one IT monitoring solution.
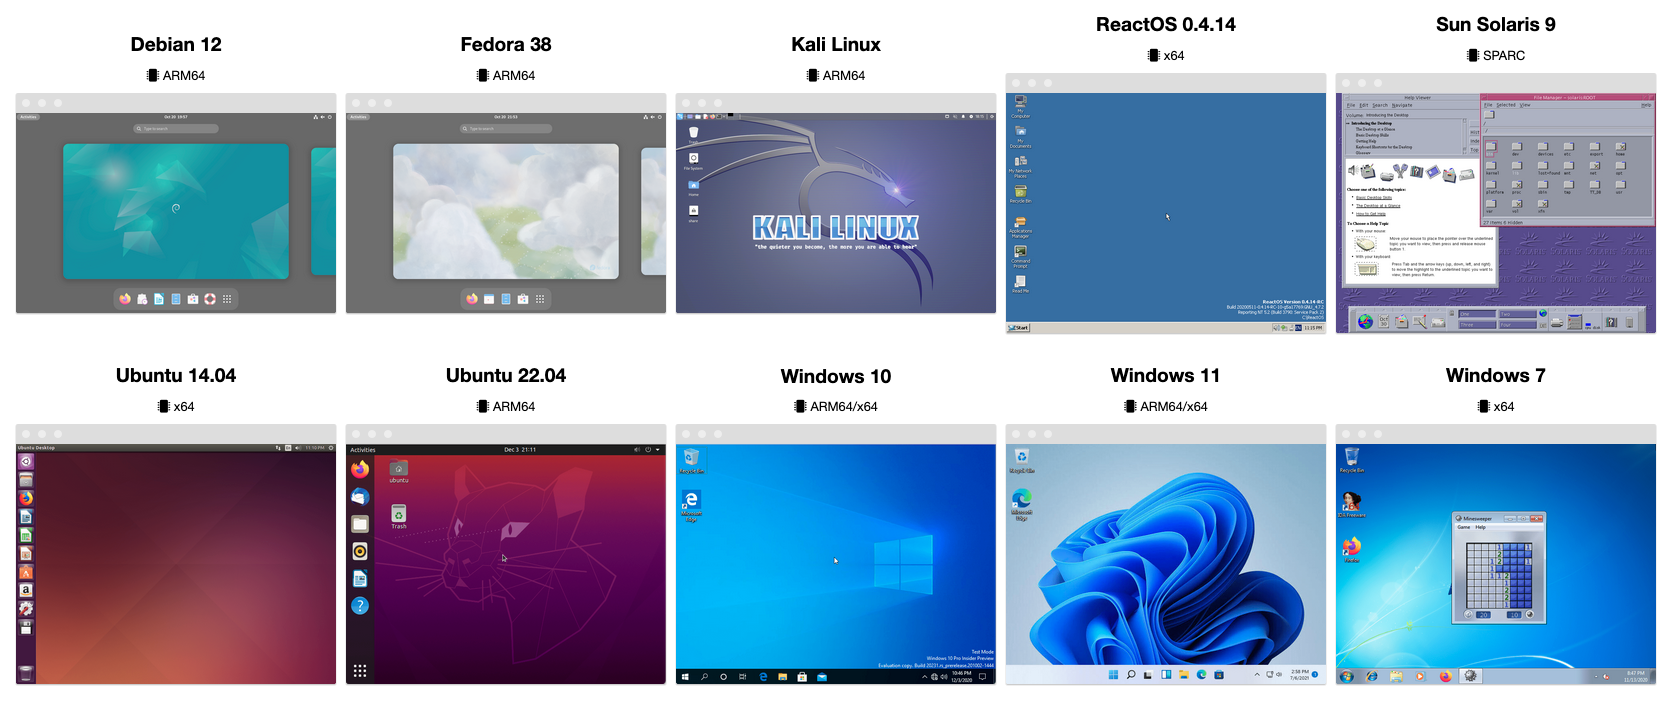
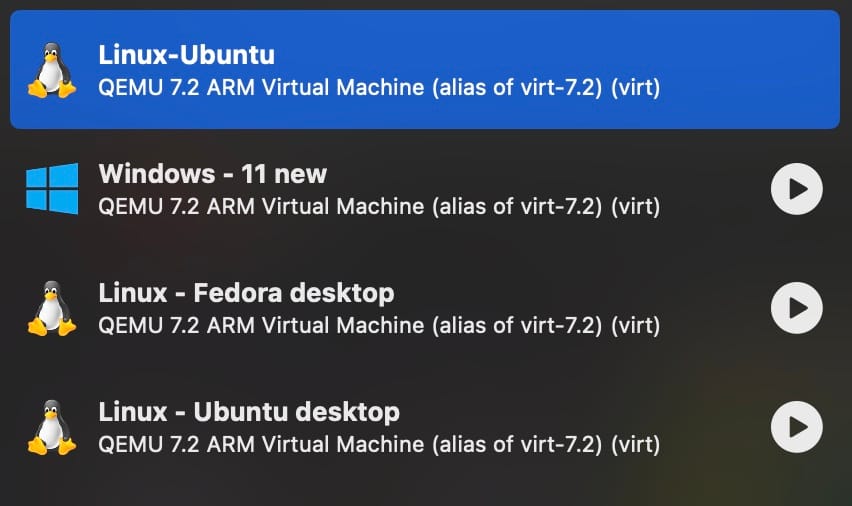
Wrapping up with VMs now, I recommend any Mac users to try out UTM. It's an effective virtualization tool to fill any OS gaps you may have, in my case allowing me to run a Windows 11 or multiple Linux distros instances from my Mac. The VMs utilised must match the host machines architecture (in my case, ARM-based), but if you're happy with a slightly less performant experience, you can choose to emulate a variety of other machines. Check out the options available in UTM here.
That's all from me. Tschüss!